
Evaluation of copper, calcium, lead, cadmium and chromium levels in serum, urine and stones in patients with renal failure compared to healthy subjects in Al-Sadr Teaching Hospital in Najaf
Article Sidebar
Main Article Content
Abstract
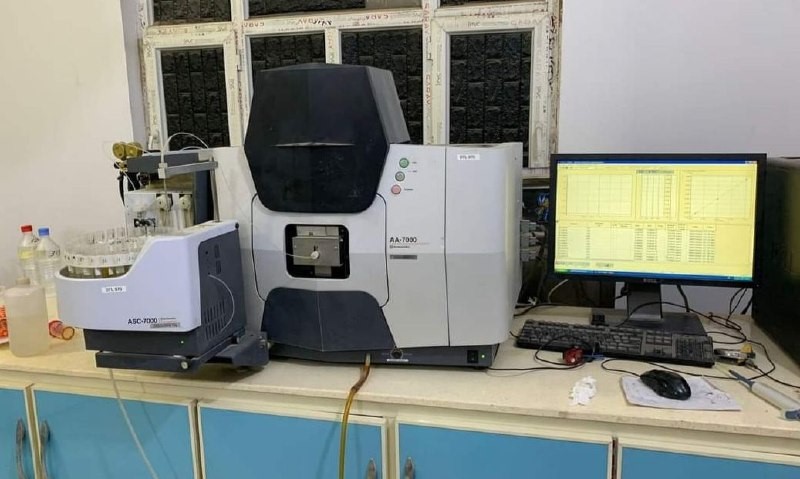
Exposure to heavy metals is the most serious threat to human health and biological system,Too much and too little of it does a great deal of harm, including toxicity. Recently, an increase in the incidence of renal failureIt was observed in Al-Sadr Teaching Hospital in Al-Najaf Governorate and it is a major driver for measuring the concentration of heavy metals inHuman serum, urine, and gravel. In this study, 20 (10 men and 10 women) patients with renal failure were taken against 20 (10 men and 10 women) healthy subjects.Peoples Volunteers. It was found that the level of lead in blood serum, urine, and stones, respectively, ranged between (27.3992 PPM - 0.4689 PPM ppm, Mean ±SD = 7.4731 ± 19.923 ppm), (1.2978 - 0.0000 mg/L). , Mean ±SD = 7.4731 ± 19.923 ppm, ), (64.8876 MG/KG - 0.0000 MG/KG) , Mean ±SD= 11.8699 ± 54.9193 MG/KG inKidney failure patients were found (128.186 ppm - 0.3015 ppm, Mean ±SD = 11.255 ± 10.923 ppm,) in the healthy group. It was found that the value of cadmium in blood serum, urine and stones, respectively, ranged (26.4340 - 3.9280 PPM, Mean ±SD = 9.7437 ± 5.8836 ppm), (0.2439 - 0.0004 mg/ L , Mean ±SD = 9.7437 ± 5.8836 ppm,),(6.5469 MG/KG - 0.0000 MG/KG, Mean±SD = 0.9731 ± 5.4970 MG/KG in patients with renal failure) but on her(22.7242 - 2.3568 PPM, Mean ±SD = 8.322 ± 5.88 ppm, in the healthy group). It was found that the value of copper ranges from (0.4092 -0.7415 ppm, mean ± SD = 0.5362 ± 0.1023 ppm in the healthy group. It was found that the value of copper in blood serum, urine, and stones, respectively, ranged from (3.6553 – 0.1536 ppm, Mean ±SD = 1.6772 ± 1.5244 ppm), (1.2948 – 0.0523 mg/L, Mean ±SD = 1.6772 ± 1.5244 ppm), (65.8539 mg/kg – 0.0034 mg/kg, Mean±SD = 13.4887 ± 52.40 mg/kg in patients with renal failure) find the value of copper present (3.0410 – 0.2765 ppm, Mean ±SD = 1.447 ± 0.830 ppm) in the healthy group. It was found that the value of calcium in blood serum, urine and stones, respectively, ranged ((114.587 – 0.6347 ppm , Mean ±SD = 9.6044 ± 8.0777 ppm), (( 0.3248 0.0000 mg/L , Mean ±SD = 9.6044 ± 8.0777 ppm),(114.587 MG/KG – 0.6347 MG/KG, Mean ±SD = 9.5762 ± 8.60 mg/k in patients with renal failure) found the value of calcium present (32.2354 – 1.2695 ppm , Mean ±SD = 4.514 ± 3.2759 ppm in the healthy group. It was found that the value of chromium in blood serum, urine and stones, respectively, ranged (72.6293 – 3.3157 ppm, Mean ±SD = 24.69 ± 21.36 ppm),( 0.5676 – 0.0000 mg/L , Mean ±SD = 22.7585 ± 21.673 ppm), ( 9.4595 MG/KG – 0.0000 MG/KG, Mean ± SD = 1.8303 ± 7.60 mg/kg in patients with renal failure) Find the value of chromium present (72.6293 – 3.3157 ppm, Mean ±SD = 24.69 ± 21.36 ppm) in the healthy group. This study concluded that the mean chromium concentrations are highest in serum samples, then co, then cd, then pb and lowest in serum samples. It was found that average carbon dioxide concentrations were highest in urine samples, then lead, then copper, then CR, and lowest in blood serum samples.Average copper concentrations are highest in the stone, then lead, then calcium, then chromium samples and lowest in the CD serum samples. Mean heavy metal concentrations are higher in the Cr and pb serum samples of healthy subjects, whereas the mean heavy metal concentrations are present in the Ca and Pb serum samples of healthy subjects. Copper and cadmium are higher in patients.